


Upcoming Event in Spain from Apr 27 to Apr 30, 2024
Meet us in Spain.
Our internet site may contain information that is not approved in all countries or regions. To ensure accuracy of content, please select your country/region of residence. Choose International if your country is not listed.
This information will be saved using cookies. To find out more about cookies, read our Privacy Policy.
Please select your country of residence. Choose International if your country is not listed.
Our internet site may contain information that is not approved in all countries or regions. To ensure accuracy of content, it is required that you select the site which is appropriate for your country of residence.
MetaSystems has been developing and producing system software for automated microscopy since 1986. Today, users in more than 103 countries rely on the laboratory solutions by MetaSystems.
In addition to generating the highest quality images, our modern approaches include an advanced workflow management that grows with your requirements.
You would like to discover what others are accomplishing with their MetaSystems products? Read through the list of peer-reviewed publications from our customers!
If you do not find what you are looking for, please do not hesitate to contact the MetaSystems partner in your region.
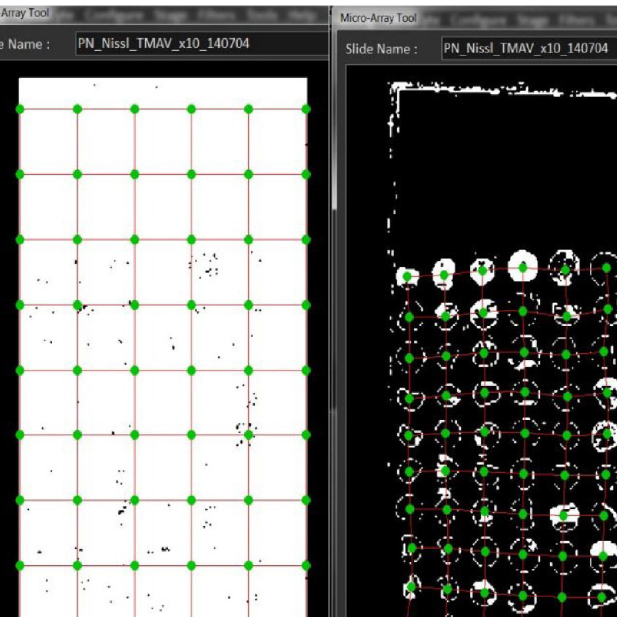
A TMA consists of an array of cylindrical tissue cores extracted from different paraffin-embedded tissue ‘donor’ blocks, which are subsequently punched into a ‘recipient’ paraffin block. In diagnostic applications, there has been concern as to whether 0.6 mm or 1 mm cores are accurately representative of a tissue cross-section containing heterogeneous tumour cell populations. [...], commercially available systems such as the VSlide scanner (MetaSystems) coupled with MetaMorph software (Molecular Devices) can streamline image acquisition and analysis of cores. This coupling of scanner and software enables high-throughput processing of immunolabelled TMA sections, and thus avoids the effects of inter- and intra-observer subjectivity that is intrinsic to manual microscope analysis. [...] We demonstrate the use of VSlide scanner [...] coupled with [...] image analysis software to analyse tissue microarrays in a cost effective and user friendly manner. [...] VSlide offers a customisable and user friendly tissue microarrayer tool enabling easy TMA acquisition by non-experts. [...], automated image analysis based methods provide objective, consistent and reproducible pathological assessment.
Cited From: J Neurosci Methods (2015)
Read more...
All Publications
![]() MetaSystems Probes now has its own website. If you are looking for MetaSystems XCyting DNA Probes, please visit the MetaSystems Probes website.
MetaSystems Probes now has its own website. If you are looking for MetaSystems XCyting DNA Probes, please visit the MetaSystems Probes website.
We hope you had a chance to meet us.

The meeting was a great time of exchange and collaboration in Oman.
